As consumers we’re well aware, and surely every business leader knows: Data is Alive!
Every day, data is constantly flowing to and from our customers, it surrounds and defines all our business processes, it changes as our efforts change, and affects our options and decisions. It goes without saying: we need to know how to collect, analyze and use all of the data that defines our business, for lots of reasons — to understand trends more quickly, to be more efficient, to know what our customers want and need.
Just how big can all this data get?
And it gets much bigger still, when looking at economic data at higher levels — large organizations, segments, verticals, the entire national economy.
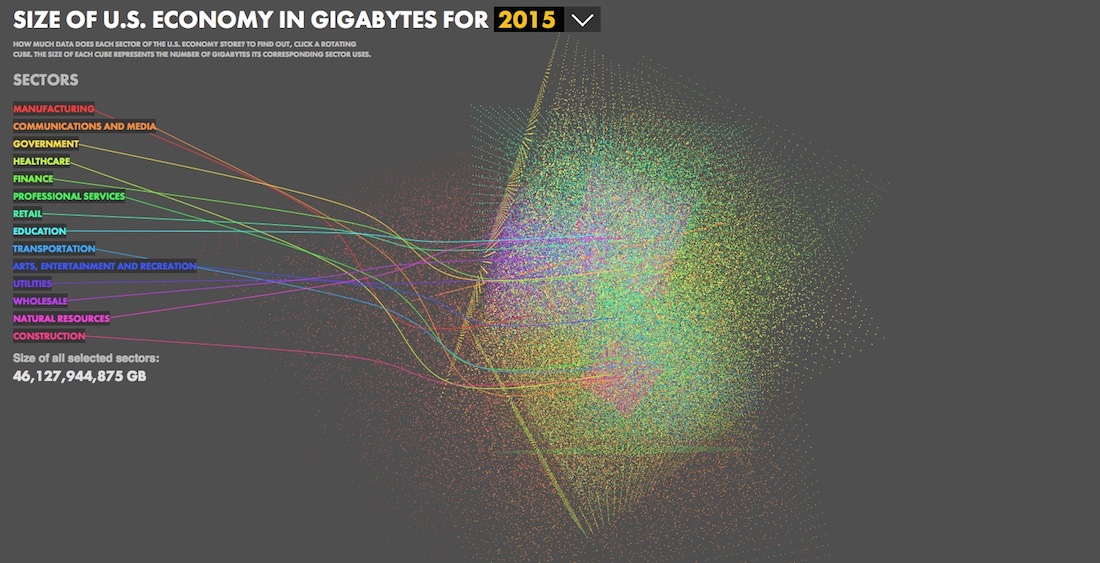
But how big is it, exactly — and how can we make sense of its magnitude? To find out, we decided to model the amount of data the U.S. economy stores, in gigabytes (GB), by sector. As you’ll see, it’s mind-bogglingly big — and, as it turns out, it’s beautiful too.
Our interactive visualization is live at The Atlantic — check it out: the Invisible Infrastructure.
A visual cascade showing the size of data in each industry
It presents a compelling (and really cool) visual cascade of data showing a graphical view of the amount of data stored by each industry type — you can click on any number of industries to get a view of how much data they use, and click on one block of data to read a few details about how each industry is benefiting from its data.
For example, click on the Transportation sector and you’ll discover it’s experiencing a data boom, as more transport scheduling (for people and products) becomes automated and the supply chain turns to more sophisticated logistics.
You can also click and choose a different Year, to look back in time or see some predictions in each segment for the future.
 Appreciation for an interesting data story
By the way, Seagate’s been telling the story of data in many interesting ways this year, but this work on The Atlantic has caught more than its share of eyeballs. It was even picked as FWA’s (Favorite Website Award) Site of the Day.
FWA showcases future-thinking progressively-designed sites that use cutting edge technology and inspirational ideas — hey, that’s the kind of stuff that drives even more data manipulation! The Site of the Day is chosen by a panel of professional designers based on creativity, originality, design, content and personality.
Take a minute to go browse and click a few of the cool, fluidly rotating data cubes, it’s a kick!
–
Who is John Paulsen? A creator, family man and former small-business leader myself, I feel your pain (and joy) and hope you’ll enjoy the blog. I launched and ran a well-regarded production company in San Francisco with a team of 9 brilliant, hard working people. I learned to manage a wide array of tasks a small business must handle — business strategy, facilities design, HR, payroll, taxes, marketing, all the way down to choosing telecom equipment and spec’ing a server system to help my team collaborate in real-time on dense media projects from multiple production rooms. I’ve partnered with and learned from dozens of small business owners.