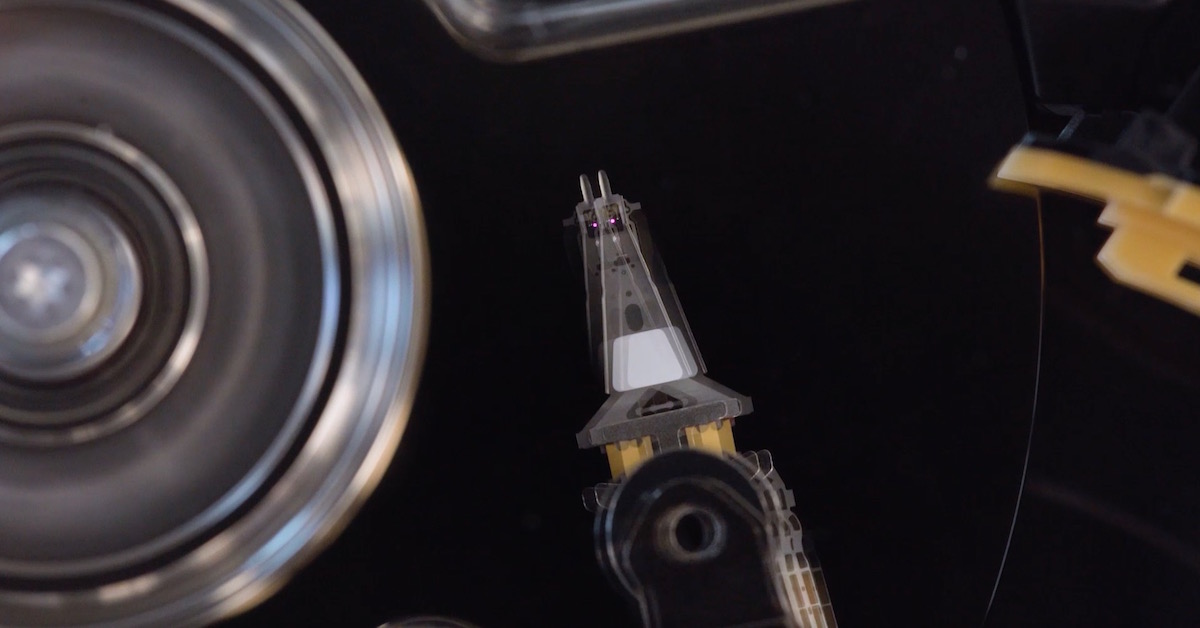
You may have read my colleague Dan Lingenfelter’s recent posts about how workload affects hybrid drive performance; today I would like to extend the hard drive workload vs. performance discussion to the case of cloud object storage. Specifically, I will present results from object storage performance tests performed using two kinds of hard disk drives: Seagate Constellation ES.3 and Seagate Terascale. While Terascale drives cost less and consume less power, the Constellation ES.3 drives have a higher reliability design and better performance. Now, let’s look at how the drive’s performance affects system-level performance and how that may also factor into your IT decision.
In my previous post, I presented our methodology for benchmarking object storage solutions. Reviewing briefly, I provision a small Swift object storage setup consisting of one proxy and one object storage server. Then, I test the system with a series of workloads that vary in object size, worker count, and get:put ratio. First, the object storage server is filled with 60 Constellation ES.3 drives and tested; then, I replace the drives with 60 Terascale drives and repeat the tests.
I use the average bandwidth achieved for each workload as the measure of performance. Figure 1a shows the get (read) bandwidth achieved for each of the workloads when the object storage server is filled with Constellation ES.3 (gray) and Terascale (orange) drives. Figure 1b shows the put (write) bandwidth. The measured bandwidth approaches the theoretical network maximum (10 GbE = 1250 MB/s; horizontal red line) for many of the large-object size workloads when using either drive type. However, the Constellation ES.3 drives afford a larger throughput for a number of workloads that are not constrained by the network bottleneck.

Figure 1: a) Get (read) and b) put (write) bandwidth for each of the workloads. The horizontal red line indicates the 10 GbE network limit.
Statistically, how do the different drive models stack up? For gets, Constellation ES.3 drives perform better in 140 out of the 160 workloads by an average margin of 18.9%. The results are similar for puts: the Constellation ES.3 drives perform better in 115 out of 160 workloads by an average margin of 15.3%. For the remaining workloads, the performance difference is within the experimental uncertainty of ±7%.
What can one take away from this study? While system-level performance sometimes masks the performance of the hard drives, proper drive selection is also important. The next time you are faced with the decision of which hard disk drives to purchase for your cloud storage application, you may want to consider the workload that the drives will be seeing in addition to cost and reliability in order to get the best possible return on your investment.
Author: Kelsie J. Betsch