In my previous posts on hard drive performance modeling and performance acceleration with hybrid drives, I discussed how the workload seen by the drive impacts performance. In most cases, measurements will provide the most accurate characterization of the drive-level workload. In this post, I’ll discuss one method for measuring the workload seen at a hard drive on a Linux system with open-source tools.
Each block of data stored on a hard drive is given a logical block address (LBA). When the host system sends a read or write command to the drive, it tells the drive to read or write the data located at one or more LBAs. We can use the blktrace tool to record the starting LBA, transfer size, timestamp, and many other attributes for each request sent to the drive. We can then use the recorded data to compute the read/write percentages, sequential percentage, and transfer size distribution. Below I’ll provide a more detailed, hands-on description of how we can obtain this information.
Generating and Recording Drive Workloads
I’ll illustrate how to measure a workload with an example where we will write a 10GB file to a disk and use blktrace to record the requests to and from the drive. Let’s assume that we have a folder at /<trace folder> where we will record the trace and another folder /<test folder> where we will write the test data. In my setup, these folders are located on different physical drives to be sure that the recorded trace is as pure as possible.
1) To start recording, navigate to /<trace folder> and start blktrace with the following command, where sdX is the name of the drive where /<test folder> is physically located.
sudo blktrace -d /dev/sdX
2) Now write a 10GB file to /<test folder>/ with a series of 64kB transfers. I used a separate terminal and fio as follows:
sudo fio ten_gb_write.ini
The contents of ten_gb_write.ini are included at the end of the post.
3) When the write finishes, press Ctrl+C to stop the trace in the terminal where blktrace was running.
4) To make the output of blktrace readable, we can use blkparse to extract the information that we need. I used the command
blkparse sdX -f “%5T.%9t, %p, %C, %a, %d, %S, %Nn” -a complete –o output.txt
This will create a file with the timestamp, requesting host process, operation type (read/write), LBA number, and number of LBAs read or written for each transfer. The –a complete filters the trace so that we only see commands that were completed.
Using the steps above we can examine the workload a drive experiences for various system-level workloads generated with fio.
Interpreting the Results
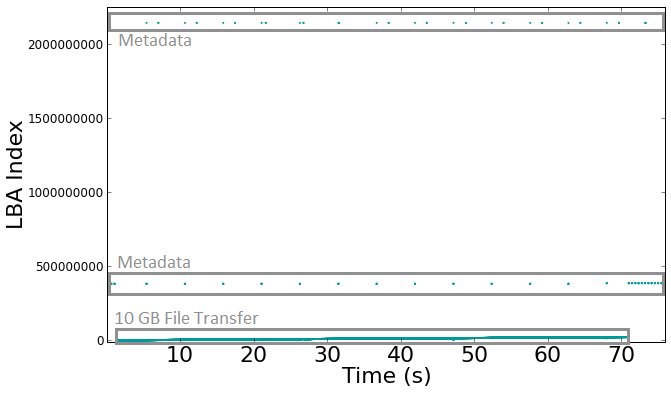
The figure below shows the starting LBA of each transfer as a function of time. The large solid line in the low end of the LBA space is the file that I wrote. There are also a series of dots that are in other parts of LBA space that are caused by operations for the operating and file systems. The transfer of the 10GB file is not entirely sequential due to these other transfers in other ranges of the LBA space.
Figure 1 – Logical Block Address (LBA) written versus time while the host system is writing a 10GB file to the drive being monitored.
After analyzing the trace data, I found that 99.5% of the transfers were sequential, 100% were writes, and 97% had a size of 512kB. The dominant transfer size is 512kB and not 64kB as I specified with fio because the Linux IO scheduler will, by default, merge requests for adjacent LBAs until the transfer reaches a system-specified maximum, which in this case is 512kB. Analyzing the trace data allows us to understand the impact of metadata and the Linux IO scheduler on overall performance.
Conclusion
This experiment showed an example of how to use blktrace to characterize a workload at the drive level. The measurement showed that the actual workload seen by the drive was different than the parameters used to generate the system-level workload would suggest. Metadata overhead interrupted the sequential large file write, while the optimizations performed by the Linux IO scheduler increased the transfer size seen by the drive. Understanding the connection between system-level workloads and the IO pattern that the drive experiences is essential to optimizing performance.
Author: Dan Lingenfelter
ten_gb_write.ini:
filename=/<test folder>/fio.tmp
iodepth=512
size=10000M
ioengine=libaio
direct=1
[job]
numjobs=1
bs=64k
rw=write


